
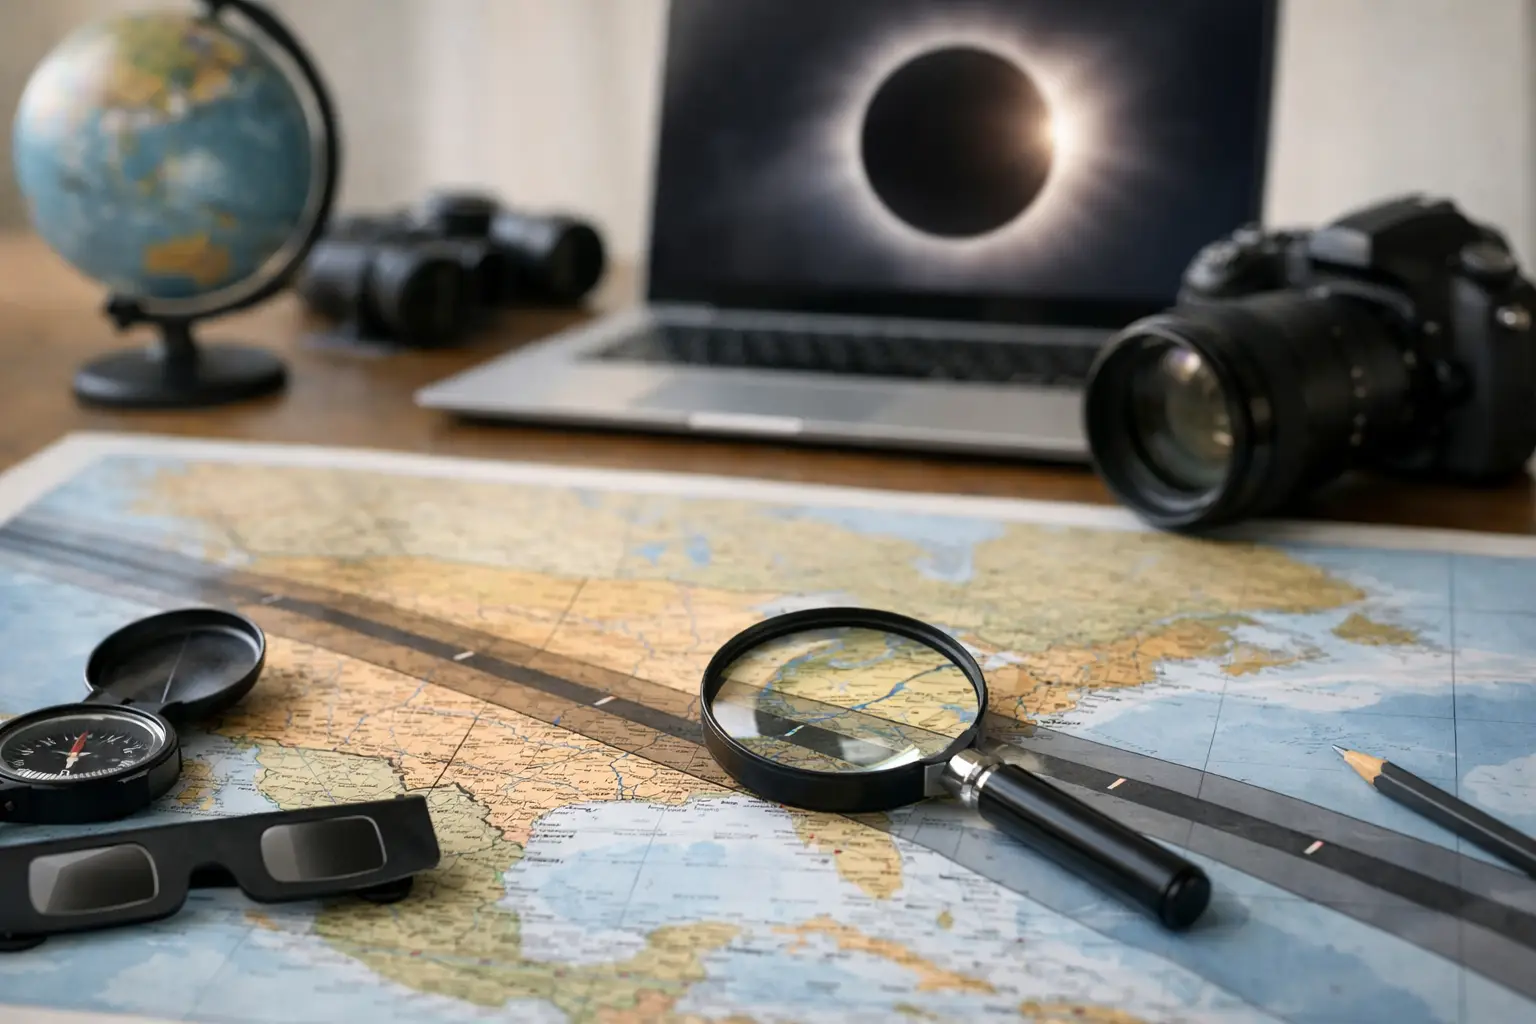
An eclipse map has one job: turn a spectacular celestial event into a real-world observing plan. This eclipse map review evaluates the features that matter most for the total solar eclipse on August 12, 2026 – from the centerline and contact times to weather layers and horizon checks. For US observers, this is primarily an international travel event: totality will not cross the United States, although parts of Alaska will see a partial eclipse.
| 2026 eclipse data point | Value | Why it matters on a map |
|---|---|---|
| Date | August 12, 2026 | Sets the travel, weather, and daylight-planning window. |
| Greatest eclipse | 17:46 UTC | A benchmark for checking whether local map times are correctly converted. |
| Maximum totality | About 2 minutes 18 seconds | Shows why a few miles of positioning can materially affect your experience. |
| Maximum path width | About 294 km | Defines the broadest section of the Moon’s shadow on Earth. |
Eclipse Map Review Criteria
The best map is not the one with the flashiest animation. It is the one that answers four practical questions immediately: Will I see totality? When does it happen at my exact location? How long does it last? Can I actually see the Sun from that spot?
For the August 2026 event, the central path runs across the Arctic, Greenland, Iceland, and Spain. The greatest eclipse occurs near 65.2 degrees north latitude and 26.1 degrees west longitude, at 17:46 UTC. This is a high-latitude eclipse, and that geography changes the planning equation. A map that displays the path without local solar altitude and horizon context is only doing half the job.
A useful eclipse map should open at the full-path view, then let you zoom from a continental scale to a chosen road, beach, harbor, or field. At the broad level, you need to see the totality corridor and the direction in which the shadow travels. At street level, you need a location pin with event data attached to it. A shaded path alone is not enough.
The centerline is the first layer to inspect. It marks where totality is longest, but it is not automatically the best place to stand. Weather, crowd access, terrain, transport, and the Sun’s position can easily outweigh an extra 10 or 15 seconds of darkness. The centerline gives you a performance target. It does not replace judgment.
Contact times must be location-specific
A dependable map should show all four solar contacts. First contact, C1, is when the Moon first appears to touch the solar disk. Second contact, C2, starts totality. Third contact, C3, ends it. Fourth contact, C4, marks the end of the partial eclipse.
C2 and C3 are the mission-critical times for totality observers. A map should present them in local civil time and UTC, clearly labeled. That detail is especially valuable on a route spanning multiple time zones. Iceland uses UTC year-round, while mainland Spain observes Central European Summer Time in August, which is UTC+2. A display that leaves time-zone handling vague can put an observer off by an hour, not a few seconds.
Look for a countdown that updates after you drop a pin. Even better, the map should state totality duration at that pin rather than merely quoting the maximum duration for the entire eclipse. Near either path edge, totality falls away fast. A site inside the line is not necessarily a site with a satisfying duration.
The Layers That Separate a Planner From a Poster
Path boundaries and timing are the foundation. The next layer is terrain. On August 12, the Sun will sit relatively low for many locations along the northern part of the route. A ridge, building, cliff, or even a line of tall trees can block the view shortly before or during totality. An eclipse map earns its place in your trip plan when it includes elevation information, a local horizon profile, or an integrated sun-altitude readout.
The map should also make path limits impossible to miss. The northern and southern limits are not decorative lines. They are the border between totality and a partial eclipse. Just outside them, the sky may dim dramatically, but the solar corona never becomes visible to the naked eye. That is the central distinction every map needs to communicate with total clarity.
Duration contours add another high-value layer. These lines show how totality changes as you move away from the centerline. They help solve a common planning trade-off: whether to stay close to the centerline in a crowded destination or move toward a clearer, more accessible site while giving up some duration. With a maximum of about 2 minutes 18 seconds in 2026, this choice deserves more attention than it did for the April 8, 2024 eclipse, whose maximum totality reached about 4 minutes 28 seconds.
Weather information should be treated differently from eclipse geometry. The path and timing can be predicted years in advance to high precision. Cloud cover cannot. A strong map keeps these layers distinct, then adds forecasts only as the event approaches. Ten-day forecasts are useful for spotting broad patterns; 24- to 72-hour forecasts are where route decisions become real. On eclipse morning, a live cloud layer and a shortlist of alternate viewing sites can be worth far more than a perfect reservation at a cloudy centerline location.
Where an Eclipse Map Can Mislead You
Even excellent tools have limits. A map pin represents coordinates, not access. It cannot guarantee that a rural road has legal parking, that a trail is open, or that a waterfront viewpoint faces the correct horizon. Treat the map as your navigation and timing engine, then verify the ground reality before departure.
Precision labels also need context. Predicted contact times may be listed to the nearest second, but your actual experience can shift with your position, elevation, and the exact horizon available to you. That does not make the calculation unreliable. It means a map should encourage you to arrive early, choose a site with room to move, and avoid setting up directly on a path boundary.
Another weak point is overreliance on eclipse magnitude. For a partial eclipse, magnitude describes the fraction of the Sun’s diameter covered, not how dark the sky will become and not how much of the Sun’s area is hidden. A high partial percentage can look dramatic through certified solar filters, yet it is still fundamentally different from totality. The map should label partial and total zones in plain language, not leave users to interpret a decimal value.
How to Use the Map on Eclipse Day
Start by saving two or three candidate locations inside the totality path, preferably separated enough that they do not share the same small-scale cloud deck. Check each pin’s C2 time, C3 time, totality duration, solar altitude, road access, and horizon direction. If one location gives you 15 fewer seconds but a much wider sky view and an easier exit route, it may be the smarter call.
Arrive at least 90 minutes before C2. That gives you time to settle in, test camera settings if you are imaging, and watch the partial phase begin. Use ISO 12312-2 compliant solar eclipse glasses for every partial-phase view. Remove them only during totality, between C2 and C3, when the bright solar disk is fully covered. The instant the first bright bead of sunlight returns, put the glasses back on.
SpaceInformer-style live tools are most useful when they reduce decisions rather than add more dashboards to watch. Keep your final setup simple: one pinned location, one accurate clock, one weather check, and one backup route.
The August 12, 2026 eclipse will reward observers who treat the map as a live flight plan, not a souvenir image. Pick a point well inside the path, protect your horizon, stay flexible with clouds, and be ready when the countdown reaches totality.