Track the Southern Lights (Aurora Australis) in real-time with our live Kp-Index monitor and high-resolution Aurora Oval map. This tracker provides instant solar storm data and visibility forecasts specifically for observers in Australia, New Zealand, Tasmania, and across the Southern Hemisphere.
🌌 Southern Lights Live Tracker
Real-time Solar Storm & Aurora Australis Activity Monitoring
Loading…
Connecting to NOAA space weather satellites…
Southern Visibility Guide
✨ Data updates frequently. Refresh for the latest solar activity.
Current Aurora Oval (Southern Hemisphere)
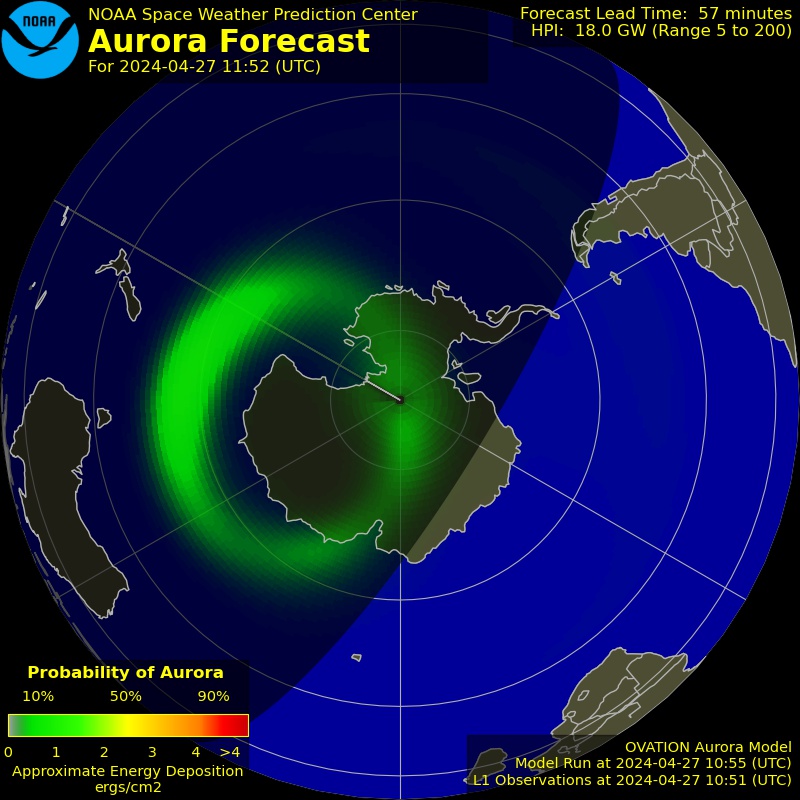
Data provided by NOAA / Space Weather Prediction Center
In the Northern Hemisphere?
🌍 Switch to Northern Lights (Aurora Borealis) Tracker →Local Aurora Australis Trackers
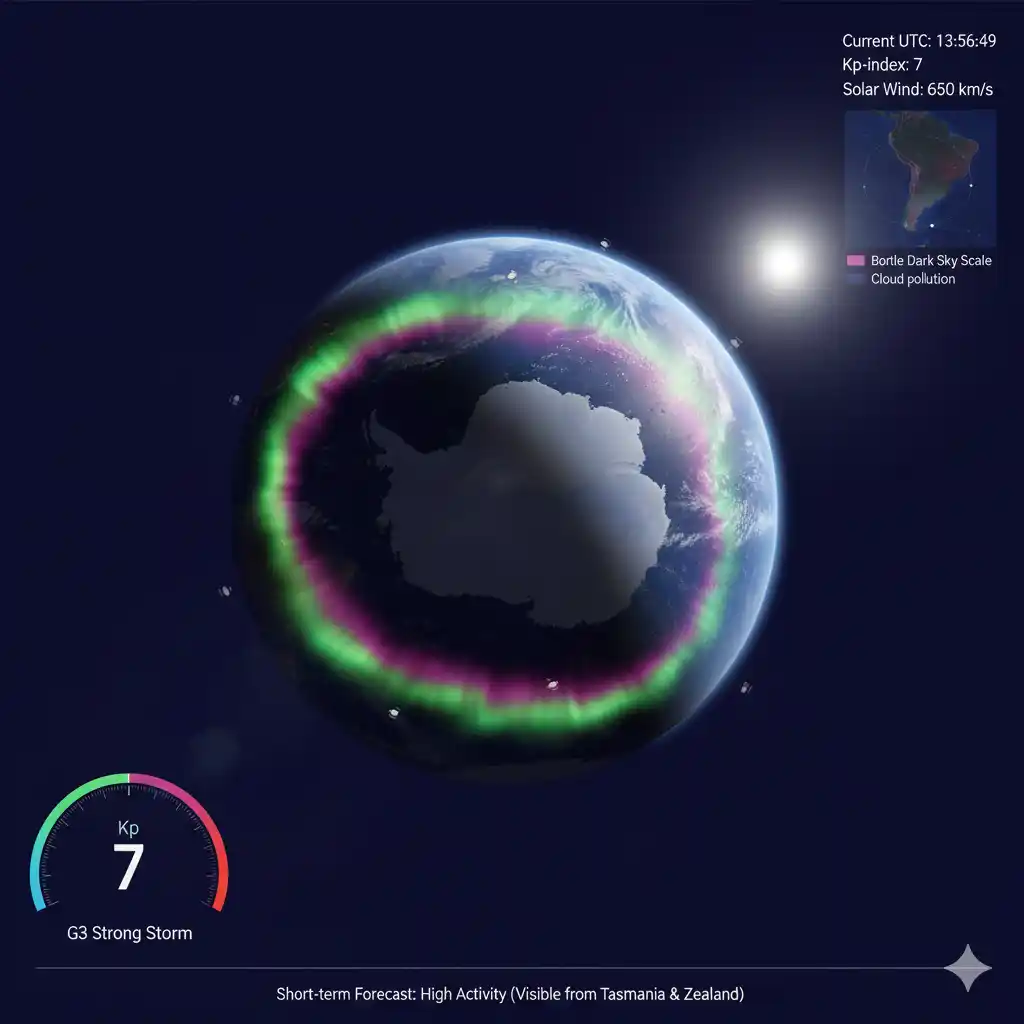
Decoding the Kp-Index for the Southern Hemisphere
The Kp-Index is the primary scale for geomagnetic activity. For Southern observers, the latitude is your biggest challenge, so knowing your “trigger number” is essential.
Monitoring the Southern Aurora Oval
The satellite map above displays the Southern Aurora Oval. Think of this as a glowing halo centered over the South Magnetic Pole.
Pro Tip for Australians & Kiwis: Look at the “Intensity Green.” If the ring is thickening and pushing toward the edges of the map, it means the auroral zone is expanding toward your latitude. Because there is so much ocean between Antarctica and Australia, you often need to look for “beams” that shoot up high into the atmosphere, even if the main curtain is still over the water.
The Science of the “Southern Swing” (The Bz Factor)
To be a master chaser, you must watch the Bz-Value. Earth is protected by a magnetic shield, but it has a “trapdoor.”
- Positive Bz: The shield is up. Solar particles bounce off, and the aurora remains quiet.
- Negative Bz (The Southward Tilt): When the Bz value goes negative (e.g., -10nT or lower), the magnetic fields of the Sun and Earth “connect.” This is the secret trigger that creates an outburst of light. Always refresh the tracker to check the Bz polarity before you head out.
Capturing the Glow: Mobile Photography Tips
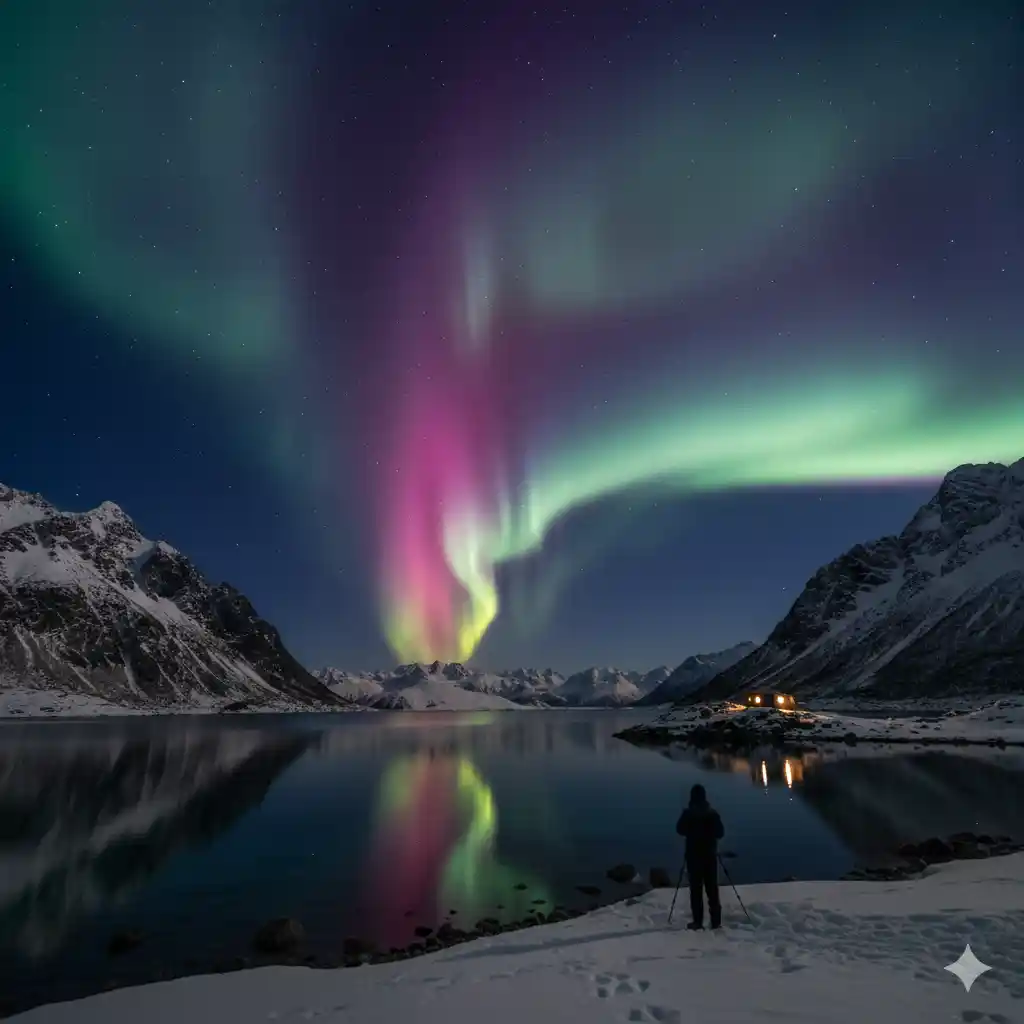
Southern Lights often appear as a “picket fence” of vertical beams on the horizon. To capture this with your phone:
- South-Facing Horizon: Find a spot with zero obstructions to the South. Beaches are perfect.
- The “Long Night” Mode: Use a shutter speed between 3 and 8 seconds.
- Infinity Focus: Ensure your phone isn’t trying to focus on nearby bushes. Lock it on the furthest star.
- Stability is King: The Southern coast can be windy. Use a tripod or a stable rock to avoid “shaky” stars.
Space Weather Forecasting: How We Predict the Glow
Predicting the Aurora Australis isn’t like forecasting rain; it’s about monitoring a 150-million-kilometer stream of plasma. Our tracker utilizes data from deep-space satellites located at the L1 Lagrange Point—a gravitational parking spot between Earth and the Sun.
Coronal Mass Ejections (CMEs) vs. Solar Wind
Most major aurora events in the Southern Hemisphere are triggered by two distinct phenomena:
- Coronal Mass Ejections (CMEs): These are massive “burps” of solar plasma launched from sunspots. A CME can take 15 to 72 hours to reach Earth. When our tracker shows a sudden spike in speed and density, it’s often the arrival of a CME “shockwave.”
- Coronal Holes: These are darker, cooler regions on the Sun where the magnetic field is “open,” allowing high-speed solar wind to escape. These often create more stable, recurring aurora displays that can last for several nights.
The Role of Solar Cycle 25
The Sun operates on an 11-year cycle. We are currently in the peak of Solar Cycle 25 (expected to last through 2026). During this period, the Sun’s magnetic poles flip, leading to a massive increase in sunspots and solar flares. For skywatchers in Australia and New Zealand, this means the next 12–24 months represent the best opportunity in over a decade to see the Aurora Australis from mainland locations.
Real-Time Telemetry Metrics
To give you the most accurate forecast, we monitor three critical real-time metrics:
- Solar Wind Speed: Normal speed is around 300 km/s. When this jumps above 500 km/s, the energy levels for an aurora display rise significantly.
- Proton Density: This measures how “thick” the solar wind is. More particles mean a brighter, more vivid display.
- Hemispheric Power: This value (measured in Gigawatts) tells us the total energy being dumped into the atmosphere. For a naked-eye show in Tasmania, we typically look for values above 50 GW.
Southern Lights FAQ
The most consistent land-based locations are Tasmania (Australia) and the South Island of New Zealand (specifically Lake Tekapo and Stewart Island). However, during solar storms, the coastlines of Victoria and South Australia offer incredible views.
The Northern Lights are easier to find because there is more land at high latitudes (Norway, Canada, etc.). The Southern Lights are “rarer” because you are usually further away from the pole, making a high-quality tracker like this one even more vital.
Autumn and Spring (March/April and September/October) are the peak seasons. This is due to the “Equinox Effect,” where Earth’s magnetic field is naturally more prone to interacting with solar wind.
Since many observers in Australia and NZ are further from the pole, they often see the top of the aurora curtains. High-altitude oxygen atoms produce red light, whereas the green light occurs lower down.
The Southern Chaser’s Checklist:
- [ ] Check the Kp-Index: Is it 4 or higher for your region?
- [ ] Check the Bz-Value: Is it pointing South (negative)?
- [ ] View the Map: Is the Aurora Oval expanding toward the Australian/NZ coastline?
- [ ] Find Dark Skies: Are you away from the light pollution of the major cities?
- [ ] Look South: Clear your view of the southern horizon.