
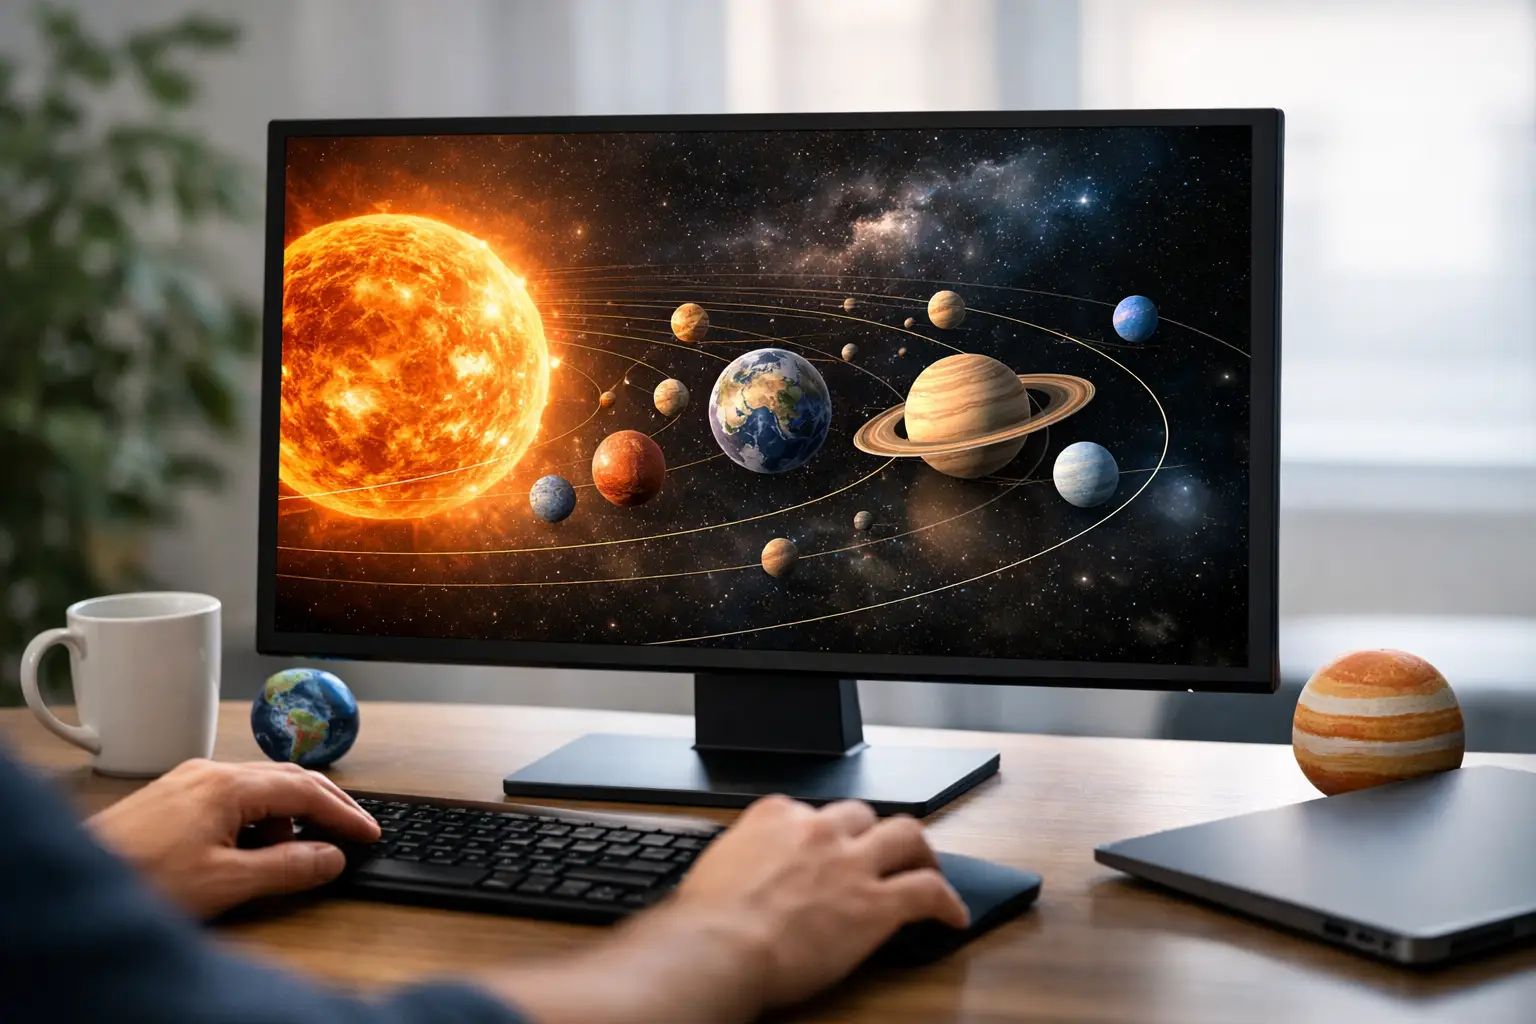
Set a solar system model 30 days forward and Earth should travel roughly 77 million km along its orbit at its average speed of 29.78 km/s. That one simple test separates a decorative planet spinner from a tool that can help you understand what is actually happening overhead. This solar system simulator review focuses on the details that make an interactive model useful for real observation planning, classroom demonstrations, and following the motion of the planets in real time.
The fastest way to judge any simulator is to compare its motion against the known scale of the solar system. The figures below are average heliocentric distances, also called semimajor axes, rather than a planet’s changing distance from the Sun on a particular date.
| Planet | Average distance from Sun (million km) | Sidereal orbital period (Earth days) |
|---|---|---|
| Mercury | 57.9 | 88.0 |
| Venus | 108.2 | 224.7 |
| Earth | 149.6 | 365.256 |
| Mars | 227.9 | 687.0 |
| Jupiter | 778.6 | 4,332.6 |
| Saturn | 1,433.5 | 10,759.2 |
| Uranus | 2,872.5 | 30,688.5 |
| Neptune | 4,495.1 | 60,182 |
What this solar system simulator review tests
A convincing simulator has two jobs. First, it needs to make orbital geometry understandable at a glance. Second, it needs enough numerical discipline that a user can trust it as the starting point for a skywatching plan. Flashy textures and cinematic fly-throughs are welcome, but they cannot compensate for an unclear time setting, an unlabeled viewpoint, or planet positions that are only loosely approximate.
The best experience opens with the present date and time clearly visible, preferably in UTC as well as local time. UTC matters because it gives every observer the same reference clock. A display set for 8:00 p.m. EDT on July 30, 2026, corresponds to 00:00 UTC on July 31. Without that distinction, a conjunction, lunar phase, or close approach can appear shifted by a full calendar day.
The time engine is the mission clock
Time controls are the center of the interface. Look for the ability to pause, step by minutes or days, and accelerate through months or years. Minute-level stepping is valuable when you are connecting a heliocentric view to a visible event. Day-level stepping reveals the broader rhythm: Mercury completes about 4.15 orbits during one Earth year, while Mars moves only about 191 degrees around the Sun in the same interval.
A strong model also lets you jump directly to a date instead of forcing endless fast-forwarding. That matters when you are checking a future opposition, comparing seasons between hemispheres, or recreating a historic alignment. The simulator should show whether its positions are calculated from an ephemeris or rendered from simplified orbital elements. Simplified models can be excellent for education, but they should say so.
Orbit shapes and scale need honest labels
Perfect circular tracks are easy to read, yet real planetary orbits are ellipses. Mercury is the clearest stress test: its distance from the Sun ranges from about 46.0 million km at perihelion to 69.8 million km at aphelion. A model that shows that changing separation gives users a more accurate feel for why orbital speed varies.
Scale creates a necessary trade-off. At true scale, Earth is nearly invisible beside the Sun and the outer planets sit far from the inner system. At display scale, the planets can be enlarged by thousands of times and their spacing compressed. That is not a flaw if the simulator labels the choice. The most useful tools offer a scale toggle, because a close-up lesson on the Moon needs a different view than an overview of Neptune’s 30,165-day trip around the Sun.
The control-room features that earn repeat use
An interactive model becomes far more useful when it moves beyond a fixed top-down diagram. The first essential control is viewpoint. Switch between heliocentric, Earth-centered, and free-camera views. The heliocentric angle explains orbital motion, while an Earth-centered view begins to explain why planets appear to reverse direction against the stars during retrograde motion.
The second is orientation. A reference plane, cardinal directions, and optional orbital trails stop the display from becoming visual noise. Planetary orbits lie close to the ecliptic, but not exactly on it. Mercury’s orbital inclination is about 7.0 degrees, while Earth’s is the reference plane at 0 degrees. Seeing those offsets helps explain why most new moons do not produce solar eclipses.
The third is event context. Useful overlays include lunar phases, planetary elongation, conjunction markers, and the current Sun-Earth-Moon geometry. A simulator does not need to bombard the screen with labels. It does need to let a user turn on the data that answers a specific question, such as whether Venus is on the morning or evening side of the Sun.
Finally, performance matters. If the view stutters when the clock is running at 30 days per second, users lose the visual thread of planetary motion. Smooth motion, immediate date changes, and readable controls are not cosmetic wins. They are what make a tool practical for a family waiting for a planet to appear, a teacher at the front of a classroom, or an enthusiast planning an observation window.
Accuracy checks you can run in one minute
Start with Earth. Its average solar distance should be near 149.6 million km, also defined as 1 astronomical unit, or AU. Then advance the date by one year. Earth should return close to its starting orbital location, while Jupiter should move only about 30 degrees because its year lasts 11.86 Earth years.
Next, inspect the Moon if the simulator includes it. The Moon’s average distance from Earth is about 384,400 km, and its sidereal orbit takes 27.32 days. Its phase cycle, measured from new moon to new moon, lasts about 29.53 days because Earth moves along its solar orbit while the Moon circles Earth. A good interface distinguishes those two periods rather than treating them as interchangeable.
Then check the reference date. Many astronomy calculations use the J2000.0 epoch, defined as January 1, 2000, at 12:00 TT. A simulator does not have to expose every technical setting, but it should identify its time standard and update position calculations consistently. That transparency is especially valuable when you are comparing a 3D model with a local sky map.
What a simulator cannot tell you by itself
A solar system view can explain why an event is possible, but it cannot always tell you whether you can see it from your backyard. Local visibility depends on latitude, longitude, horizon obstructions, twilight, weather, and a target’s altitude above the horizon. A planet 5 degrees above a tree line is very different from the same planet at 45 degrees altitude in a dark, open field.
Light travel time adds another useful layer of perspective. Mars can be roughly 3 to 22 light-minutes from Earth, depending on the geometry of the two orbits. Jupiter is typically about 33 to 54 light-minutes away. The model may display the planets at a chosen instant, but the photons reaching your eyes left those worlds earlier. For basic planning, that delay is usually not decisive. For understanding space at its real scale, it is unforgettable.
Solar system simulator review verdict
The right simulator is not the one with the most dramatic graphics. It is the one that lets you set an exact time, understand the vantage point, verify the scale, and connect what you see on screen to a real sky event. Beginners should prioritize clear labels and guided views. Experienced observers will benefit most from UTC controls, orbital trails, precise date jumps, and event overlays.
For the strongest result, use the simulator as your launch console before observing: set your location and clock, trace the geometry, then check the target’s local altitude and weather conditions. SpaceInformer is built around that move from cosmic overview to a real moment outside, where the screen becomes a plan and the sky takes over.