
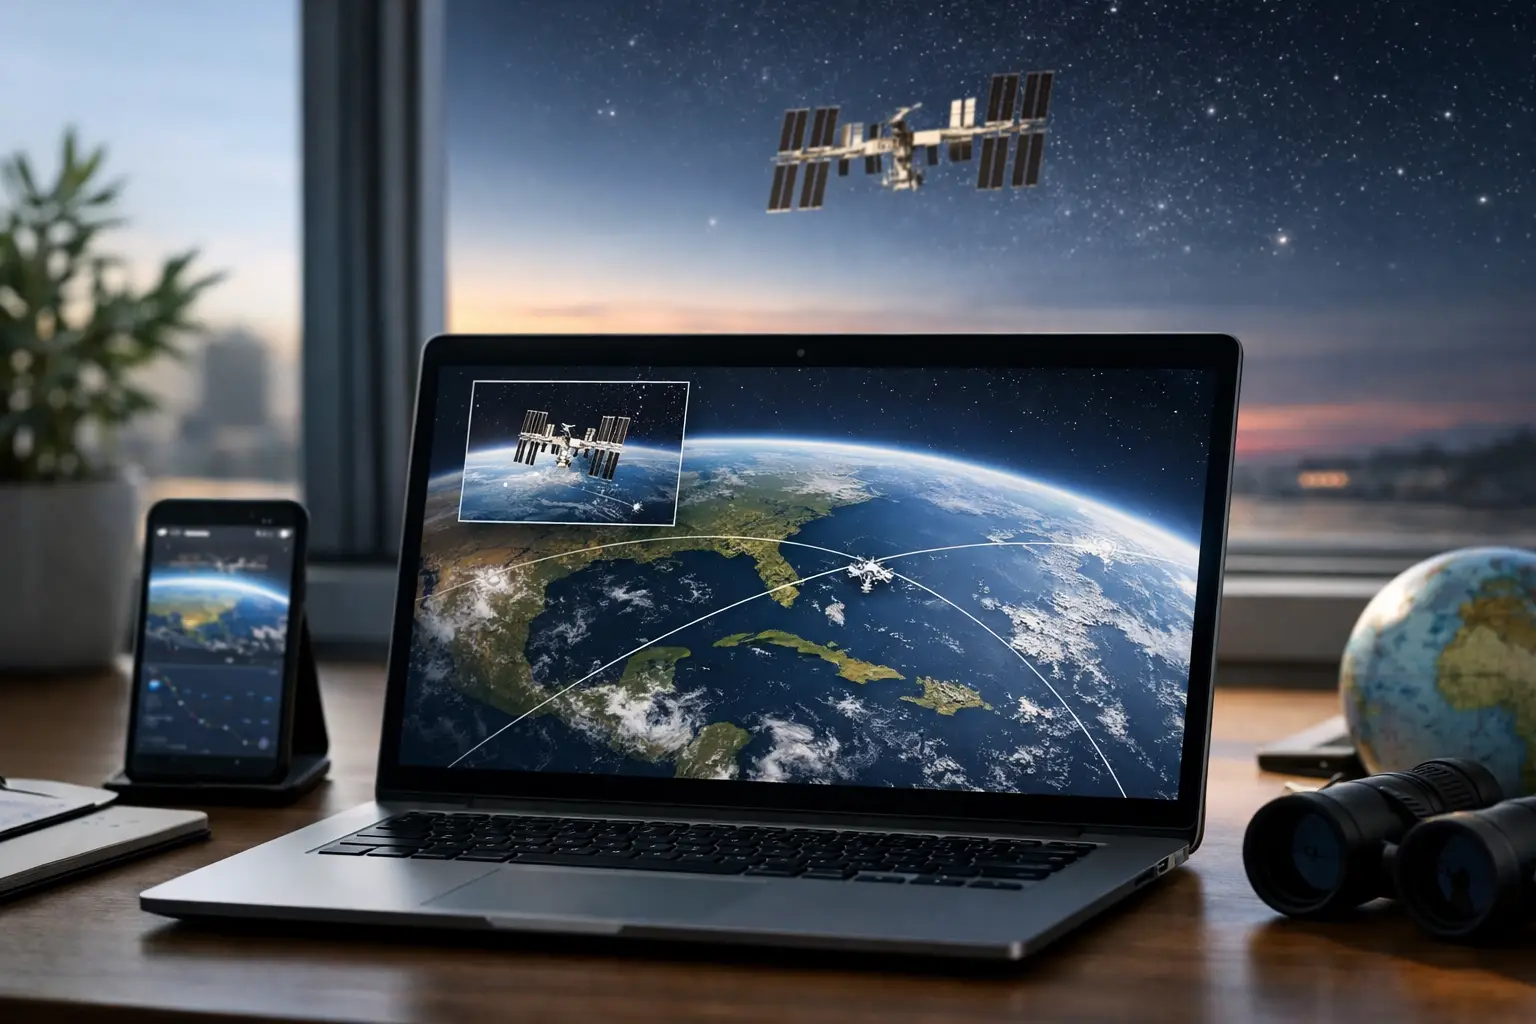
The International Space Station can cross your sky in less time than it takes to make coffee. A bright, visible pass often lasts just 3 to 6 minutes, and the difference between an unforgettable sighting and a missed one is usually a precise alert. This ISS tracker tool review looks at what makes a live tracker genuinely useful: current orbital position, location-specific predictions, clear visibility guidance, and enough mission context to make every pass feel connected to the station’s 400-kilometer-high journey.
| Live ISS data point | Typical value | Why it matters to observers |
|---|---|---|
| Orbital altitude | About 370 to 420 km | Altitude changes the station’s apparent path and when it enters sunlight. |
| Orbital speed | About 27,600 km/h | The ISS moves rapidly, so a pass prediction needs minute-level timing. |
| Orbital period | About 90 minutes | The station circles Earth roughly 16 times every 24 hours. |
| Orbital inclination | 51.6 degrees | This sets the northern and southern limits of where passes can occur. |
What an ISS tracker must deliver
A map with a moving station icon is exciting, but it is only the starting point. The ISS travels fast enough to cover a ground track of roughly 7.7 kilometers every second. For a viewer in Chicago, Phoenix, or a small town between them, the useful question is not simply, “Where is it now?” It is, “Will I see it from my exact location, when does it begin, and where should I face?”
That makes local pass forecasts the center of any worthwhile tracker. The forecast should identify the date, local start time, maximum altitude, compass direction at appearance, direction at disappearance, and total duration. A pass beginning at 9:14 PM local time at 12 degrees above the northwest horizon is a very different prospect from one peaking at 78 degrees near overhead. The first may be blocked by trees or homes. The second is the kind that gets families outside.
The best interface translates azimuth and elevation into plain observing decisions without hiding the numbers. Azimuth is the compass bearing measured from north through east, from 0 to 360 degrees. Elevation is the angle above the horizon: 0 degrees is the horizon, 45 degrees is halfway up, and 90 degrees is directly overhead. An ISS pass reaching 40 degrees or more is usually easy to follow from a reasonably open yard.
The live map earns its place
Live position is more than visual decoration when it carries a clear UTC timestamp and shows the day-night boundary. The station is most often visible from the ground when the observer is in twilight or darkness while the ISS remains sunlit at orbital altitude. That geometry explains why the strongest public viewing windows cluster after sunset and before sunrise, rather than in the middle of the night.
A useful live display should show the current ground track, the next section of orbit, and the observer’s location. It should also make its time basis obvious. UTC is the standard for orbital operations, but a US observer planning a backyard watch needs the local conversion displayed without mental math. If a tracker says 01:30 UTC on July 31, 2026, that is 9:30 PM EDT on July 30 in New York, or 6:30 PM PDT on July 30 in Los Angeles. Date confusion is one of the easiest ways to miss a pass.
ISS tracker tool review: accuracy and data freshness
The central question in an ISS tracker tool review is whether the display is driven by current orbital elements and whether it tells users when those elements were updated. Satellite prediction tools commonly use a two-line element set, or TLE, to calculate a spacecraft’s future position. A TLE has an epoch, which is the exact date and time the orbital data represents.
This matters because the ISS is not a passive object drifting on a perfectly fixed path. Atmospheric drag gradually lowers its orbit, and periodic reboost maneuvers raise it. Visiting cargo spacecraft, crew vehicles, and operational maneuvers can also affect the published orbit. A pass forecast created from old orbital data may be slightly early, late, or shifted across the sky.
For that reason, a tracker should expose a data timestamp or epoch instead of asking users to assume every number is live. Fresh data supports dependable planning, especially for a high pass. The practical standard is simple: check the forecast again on the day of the event, then open the live tracker 10 to 15 minutes before the predicted start time. If a tool has refreshed its orbital data and your location is correct, it can take you from a rough possibility to a ready-to-watch event.
There is a trade-off. Ultra-detailed orbital panels can be valuable to experienced observers, but fields such as right ascension of the ascending node or mean anomaly do not help a first-time viewer find the station. A consumer tracker succeeds when the technical layer is available, while the default view answers the immediate questions first.
The visibility forecast is the make-or-break feature
Not every ISS pass is visible, even if the ground track passes near your city. The station must be above your horizon, bright enough against the sky, and illuminated by the Sun. A good tool separates “overhead” from “visible” rather than treating them as the same thing.
Brightness is commonly expressed as apparent magnitude. Smaller and negative values are brighter. On favorable passes, the ISS can reach magnitude -3 or brighter, rivaling Venus and easily standing out in suburban skies. On a lower pass it may be closer to magnitude 0 or +1, still visible to the naked eye but more vulnerable to haze, city lights, and a bright Moon.
A confident forecast should label the quality of the pass using measurable criteria. Look for maximum elevation in degrees, predicted brightness in magnitude, and duration in minutes and seconds. It should also warn when the station enters Earth’s shadow before the pass ends. That sudden fade is real orbital geometry, not a tracking failure.
Cloud cover remains the one limitation no ISS tracker can solve. The station can be perfectly positioned at 65 degrees elevation and magnitude -2.5, yet invisible through solid cloud. Pair the forecast with a local sky check about 30 minutes before showtime. If the clouds break, the ISS does not wait.
Alerts should create action, not noise
Notifications are most helpful when they arrive early enough to act. A 30-minute alert gives you time to gather kids, step outside, and find an open view. A second alert 5 minutes before the pass is ideal for putting the phone away, facing the correct direction, and letting your eyes adjust.
The alert itself needs the essentials: local date and time, starting direction, maximum altitude, and expected duration. “ISS pass soon” is not enough when the station appears low in the southwest at 8:47 PM and is gone by 8:51 PM. A tracker that communicates those details turns a notification into an observation plan.
Interface details that improve a real observation
The most effective trackers are built for the moment outside, not just for browsing indoors. Large readable time displays, a clear countdown, a compass-oriented path graphic, and a dark-friendly viewing mode all matter. So does location control. City-level estimates can be useful, but a saved precise location provides a more relevant horizon and timing prediction.
SpaceInformer’s ISS tracking experience is strongest when used as a quick mission-control check: confirm your location, inspect the next visible pass, note the highest point, then return shortly before the countdown reaches zero. No telescope is required. The ISS is a point of light to the unaided eye, moving steadily across the sky with no flashing navigation lights and no aircraft-like sound.
For educators and families, the mission context adds another layer. The ISS has been continuously inhabited since November 2, 2000. Seeing it cross your local sky means watching a working orbital laboratory carrying out science roughly 400 kilometers above Earth, traveling around the planet about once every hour and a half. That perspective is more powerful when the tool does not bury it beneath technical clutter.
The verdict: plan around the pass, not the map
A strong ISS tracker is a planning instrument first and a visual dashboard second. Its value comes from precise local predictions, plainly labeled time zones, fresh orbital data, and visibility details that account for sunlight, elevation, and brightness. The map supplies the thrill. The forecast gets you outside at the right minute.
Before your next predicted pass, choose a horizon with as few obstructions as possible, arrive 5 minutes early, and look in the listed starting direction. When that steady point of light rises on schedule, the numbers on the screen become something far better: a live connection to humanity’s outpost in orbit.