
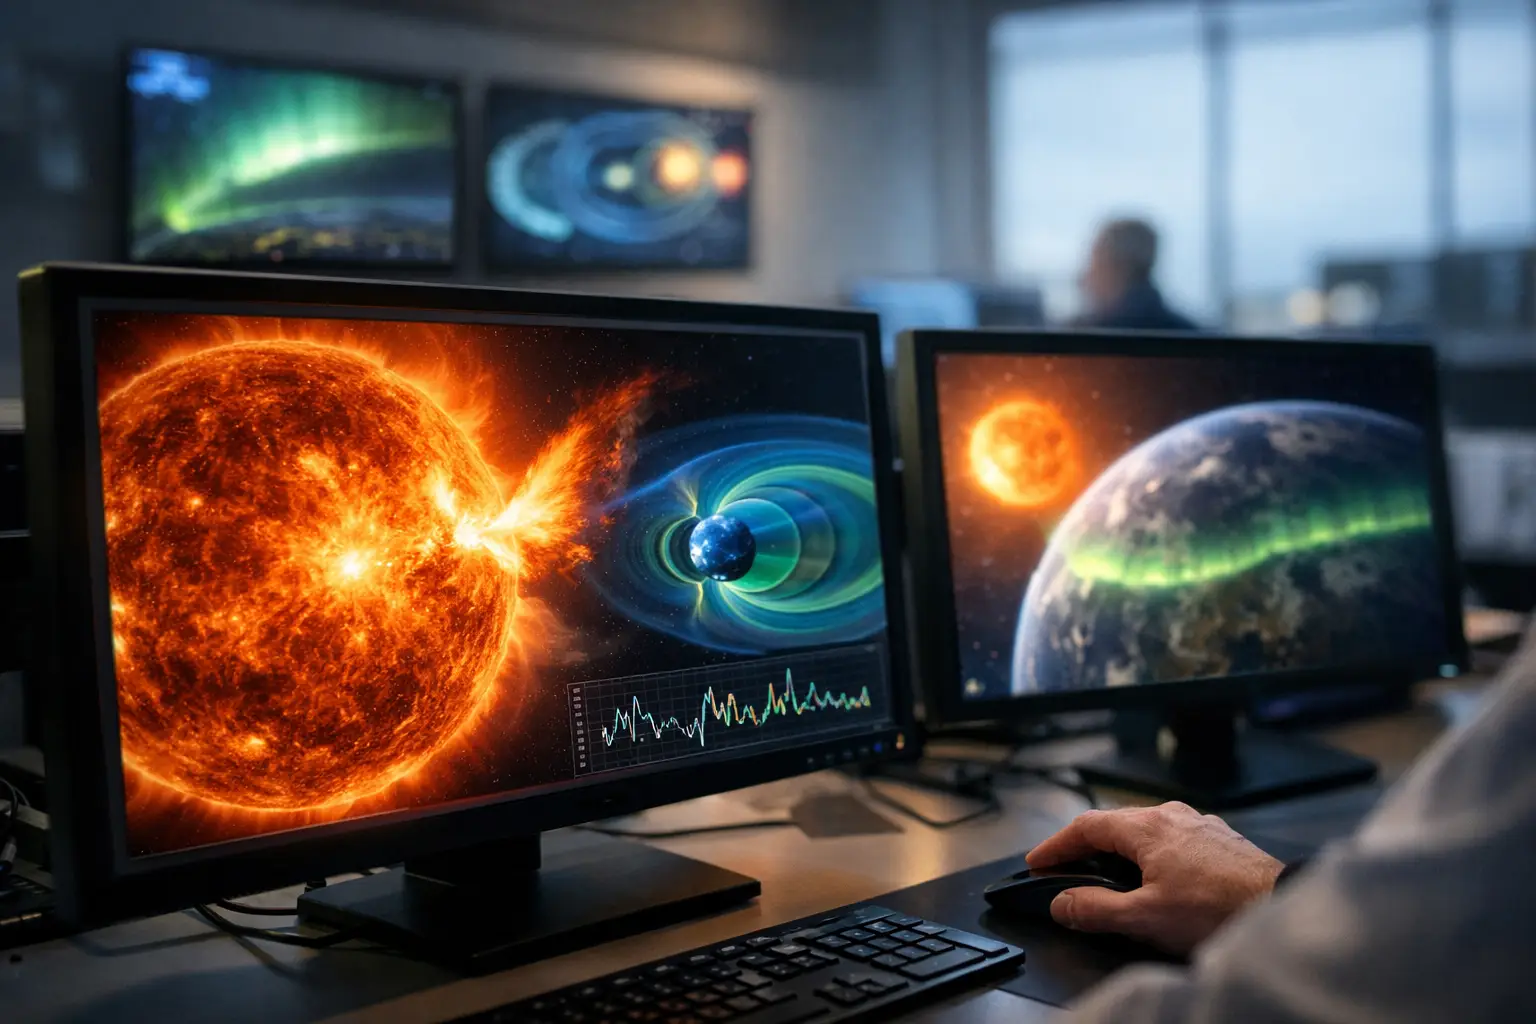
If your phone lights up with aurora alerts and space weather warnings, a solar storm tracker live is the fastest way to separate real signal from social media hype. The Sun can launch a flare in minutes, a coronal mass ejection can take roughly 15 to 72 hours to reach Earth, and geomagnetic conditions can shift hour by hour. For anyone trying to catch northern lights, protect radio operations, or simply understand what is happening above the atmosphere right now, live tracking turns space weather into something you can actually follow.
| Metric | Typical Range | Units | Why It Matters |
|---|---|---|---|
| Solar flare class | A, B, C, M, X | relative X-ray scale | Shows how intense an eruption is at the Sun |
| CME travel time to Earth | 15-72 | hours | Sets the window for possible geomagnetic storm impacts |
| Solar wind speed | 300-800+ | km/s | Higher speed can strengthen geomagnetic activity |
| Kp index | 0-9 | index | Quick read on global geomagnetic storm strength |
| NOAA G-scale | G1-G5 | storm category | Consumer-friendly severity label for impacts and aurora reach |
How a solar storm tracker live actually works
A good tracker is not just one chart. It is a stack of live inputs that each answer a different question. One feed tells you what just happened on the Sun. Another estimates whether material is headed toward Earth. A third confirms whether that material has arrived and is disturbing Earth’s magnetic field.
That distinction matters. An X-class flare sounds dramatic, but not every flare produces a CME aimed at Earth. Likewise, a CME can be launched, yet arrive weakly oriented and produce only modest geomagnetic effects. The strongest aurora setups usually need both energy and the right magnetic alignment, especially a sustained southward Bz component in the interplanetary magnetic field.
For casual users, the most useful solar storm tracker live setup combines four layers: flare detections, CME forecasts, solar wind measurements near Earth, and geomagnetic storm indices. If one of those is missing, you are only seeing part of the mission board.
The core data points worth tracking live
1. Solar flares
Solar flares are sudden bursts of radiation from active regions on the Sun. They are categorized by X-ray strength into A, B, C, M, and X classes, with each letter representing a tenfold increase in power. M-class flares are strong, while X-class flares are major events.
Radiation from a flare reaches Earth in about 8 minutes 20 seconds, essentially the light-travel time from the Sun across roughly 149.6 million km. That means radio blackout effects on the sunlit side of Earth can happen almost immediately after the flare is observed.
2. Coronal mass ejections
A CME is a huge cloud of solar plasma and magnetic field launched into space. These are the events aurora chasers care about most. Fast CMEs can reach Earth in around 15 to 24 hours, while slower ones may take 2 to 3 days.
Not every CME is Earth-directed. A live tracker should show whether the eruption appears full halo, partial halo, or off-angle from Earth’s point of view. Full halo CMEs often get attention because they can indicate material expanding toward our line of sight, but even then, impact strength still depends on speed, density, and magnetic orientation.
3. Solar wind speed and density
When a CME or high-speed solar wind stream approaches Earth, real-time upstream spacecraft data becomes critical. Typical quiet solar wind speed is around 300 to 400 km/s. During active periods, that can jump above 500 km/s and sometimes exceed 800 km/s.
Density also matters. A compressed burst of plasma can hit first, followed by the magnetic structure that determines how much geomagnetic energy couples into Earth’s field. If a tracker shows elevated speed, rising density, and a southward Bz, that is when the dashboard starts getting interesting fast.
4. Kp and geomagnetic storm scale
Kp is the number most public trackers lean on because it is simple. It runs from 0 to 9. Higher values mean stronger global geomagnetic disturbance. NOAA’s storm scale translates that into G1 through G5.
| Kp Index | NOAA Storm Level | Typical Aurora Reach in the US | Use Case |
|---|---|---|---|
| 5 | G1 | Northern-tier states, depending on conditions | Worth watching in states near the Canadian border |
| 6 | G2 | Farther south into the upper Midwest and New England at times | Good alert threshold for many US aurora chasers |
| 7 | G3 | Can extend into more mid-latitude states | Major public-interest event territory |
| 8 | G4 | Deep mid-latitude visibility becomes possible | High-impact storm with broad attention |
| 9 | G5 | Rare, potentially visible far south in the continental US | Extreme event, infrastructure impacts possible |
Kp is useful, but it is not perfect for minute-by-minute aurora timing. It is better as a broad storm indicator than a precise local visibility guarantee. Cloud cover, moonlight, your latitude, and local light pollution still decide whether you see anything.
What to look for before a solar storm hits Earth
The best live trackers let you follow the event in stages. First, watch for a significant flare from an Earth-facing active region. Then check whether a CME was associated with it and whether forecasters expect at least a glancing blow. After that, the most valuable updates usually come 30 to 60 minutes before arrival, when upstream spacecraft detect the shock front near the L1 point between Earth and the Sun.
That final hour is often the difference between vague awareness and real planning. If you are in Minnesota, Michigan, Montana, Maine, or Alaska and the solar wind speed jumps above 600 km/s with a sustained negative Bz, your odds can improve quickly. If you are farther south, you generally want stronger geomagnetic conditions, often Kp 7 or higher, plus clear dark skies.
Solar storm tracker live for aurora chasing
This is where live data becomes practical, not just interesting. If your goal is to see the northern lights, you are not tracking the Sun for fun alone. You are trying to answer three questions: Is a storm incoming, is it active now, and is my sky dark and clear enough to make it worth the drive?
For US viewers, local timing matters. Geomagnetic activity can spike after sunset, fade near midnight, and surge again before dawn. During stronger events, people in states like North Dakota or Wisconsin may get a visible display with Kp 5 to 6. In states like Colorado, Illinois, Pennsylvania, or Oregon, you often need a stronger storm and a clean northern horizon. In Texas or the Southeast, aurora visibility usually depends on rare G4 to G5 conditions.
That is why the most useful live tracker is paired with a location-based sky view. SpaceInformer’s real-time style works best when the solar data is translated into a simple question: what can I see from where I am right now?
What a live tracker can and cannot tell you
A solar storm tracker live can tell you when the Sun erupted, whether Earth may be in the path, what the solar wind is doing near Earth, and how strong the geomagnetic response is becoming. That is a powerful stack of information.
What it cannot do is promise a visible aurora in your backyard at 10:17 PM. Space weather forecasting still has real uncertainty. The biggest wild card is magnetic orientation inside the CME. Forecasters may know a cloud is coming, but the strongest geoeffective field often cannot be confirmed until the plasma is already close to Earth.
That is also why storm hype gets out of hand online. A headline about an X-class flare can spread instantly, while the less flashy but more important details come later. Smart users wait for the full chain: flare, CME assessment, arrival timing, and then live solar wind confirmation.
Best habits for reading live solar storm data
Check the trend, not just the headline number. A brief Kp spike is less useful than sustained activity over several hours. Look for speed, density, and Bz together rather than treating any one value as magic. And keep your observing reality grounded – a Kp 6 event under thick cloud is still a no-show.
It also helps to think in windows instead of exact times. If a CME is forecast to arrive between 12:00 UTC and 18:00 UTC, that means US observers may need to monitor conditions across the afternoon and evening, not just at one fixed minute. Real-time space weather is dynamic by nature.
Why interest in solar storm tracking is surging
Part of it is simple: more people are seeing aurora farther south during the current solar cycle. Solar Cycle 25 is moving through an active phase, and stronger sunspot activity tends to bring more flares and CME opportunities. But another reason is better public access to dashboards, models, and visual trackers that make the data readable without requiring a physics degree.
That is the sweet spot. A live solar storm page should feel like mission control for everyday observers. Fast, clear, and anchored in measurements. Not vague excitement, not dry technical overload.
If you want the best results, treat solar storm tracking like weather watching for space. Monitor the trend, trust the live numbers more than the viral posts, and be ready to move when the dashboard shifts. The Sun does not wait around, and the best nights usually belong to the people already watching.